Explanation: How BitRefine Heads works

BitRefine Heads platform is based on video processing pipeline and reporting tools. Similar to the pathways in human’s brain visual data goes from image capturing first through primary visual complex. Then it gets into main deep neural network that looks for objects of interest. Then it’s passed to the post-processor that modifies results according to the user’s requirements. Finally, data goes to external systems, to local DB, and can be analyzed through our reporting tool. Each stage of the pipeline is adjusted through the web interface.
Control through the web interface
BitRefine Heads is a client-server platform. The client-part runs through the web interface and can be accessed from any platform: Windows, Linux, MacOS. Client-part configures and controls one or multiple analyzers, so called “heads” that can run on the same pc or do their job remotely. The most compute-intensive “heads: run on GPU-powered Linux machines. Simple analyzing “heads” can be loaded on other platforms including mobile Android-based or RaspberryPi.

Multiple input options
Each analyzing “head” works with one or multiple visual data streams. We can acquire data from various sources:
- RTSP stream
- Direct stream from build-in camera
- Batch analysis of images in a folder
- On-demand image analysis through REST

Pre-processors help preparing data
In the most cases the video stream needs to be prepared in a certain way before passing it to the main neural network. So the usual pathway includes one or a sequence of pre-processors that transform images: correct resolution, color, contrast, eliminate noise or extract moving objects. Some standard pre-processors are already included into the package. In addition to these modules, BitRefine offers tailored pre-processors that help improve analysis precision or optimize CPU load at solving one or another particular task.

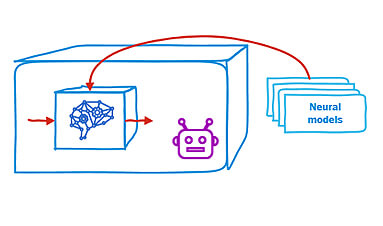
Analyzer – brain in the “head”
After visual data is prepared it is passed to the main analyzer. Unlike human’s brain, which is a universal analyzer, today artificial neural networks are trained in most cases to work effectively in one particular area. Therefore there’s not just one analyzer in our system, but many interchangeable modules. Client loads into the “head” one particular analyzing model that solves his particular task.
Our computer vision engineers have a number of tools that allow us provide clients with customized neural network analyzers at low cost and in minimum terms.
The result of analyzer’s job is can vary from one analyzers to another. Here are possible results:
- Object’s type or class
- Recognition confidence rate
- Object’s coordinates in the frame and dimensions
- Object’s parameters, such as color
This data can be passed directly to local DB or to third-party system in form of universal JSON, but usually there’s some post-processing needed.
Post-processors
In the most cases the video stream needs to be prepared in a certain way before passing it to the main neural network. So the usual pathway includes one or a sequence of pre-processors that transform images: correct resolution, color, contrast, eliminate noise or extract moving objects. Some standard pre-processors are already included into the package. In addition to these modules, BitRefine offers tailored pre-processors that help improve analysis precision or optimize CPU load at solving one or another particular task.

Output
Each “head” generates two types of results: numerical and graphical. Numerical data includes information about detected object and additional properties. Graphical is series of images.
By default, all the numerical results are just stored in local DB for further analysis through reporting section. In addition to this standard output system can save all or selected images to a folder, send data to external DB through DB connector, generate JSON messages or even execute custom scripts in case of special events.

Reporting
Web-interface’s reporting section is built to allow users get convenient visual access to the results of analysis. Full statistics is available in form of tables and charts. User can evaluate both full general situation across multiple streams or get to details within each stream separately.

Want to learn more?
We’ve got more video analytics to share. Let’s be friends. But you first...: